3. CATCHMENT AND EVENT SELECTION

The selection of suitable gauge sites, river reaches, and event for analysis is presented in this chapter.

3.1 Catchment Selection


As noted by Thukela Basin Consultants (2001), the Department of Water Affairs and Forestry (DWAF) initiated the Vaal Augmentation Planning Study (VAPS) in 1994 to determine alternative development options to meet the increased demand for water in South Africa. DWAF has found that inter-basin transfer schemes, together with other strategic actions, offer a possible and affordable means for augmenting water supplies to the Vaal River system. The Thukela River, along with several other options, was investigated for a further inter-basin transfer scheme.

According to Thukela Basin Consultants (2001) and Encyclopaedia of Nationmaster (2004), the Thukela River has its source in the Drakensberg Mountains near Bergville, where mountain peaks rise to over 3000 m. The river descends rapidly dropping 947 m, down to the Thukela falls, the mean annual rainfall (MAR) exhibits significant variation, ranging from 1500 mm or more in the Drakensberg region to as low as 50 mm in the dry central areas of the catchment.Specifically, in the mountainous Drakensberg area, the MAR exceeds 1500 mm, indicating a high level of precipitation. In contrast, the dry central regions experience considerably lower rainfall, with the mean annual rainfall dropping below 700 mm.

The Thukela catchment was selected to conduct flood routing studies due to its numerous gauging stations, long records of flow, and extensive rivers and tributaries. Additionally, the research would supplement other current research activities in the School of Bioresources Engineering and Environmental Hydrology. This disparity in rainfall distribution underscores the diverse climatic conditions within the Thukela catchment, with implications for water resource management and ecosystem dynamics.

3.2 Suitable Gauging Sites and River  Reach Selection

The factors considered when selecting suitable gauging stations for streamflow records include the availability and quality of data, as well as the suitability of the river reach to estimate flood routing parameters. This involves assessing the presence of constrictions, dams, or backwater effects resulting from inundations. Additionally, the appropriateness of the reaches to apply the Muskingum flood routing methods is evaluated. The data required for flood routing analysis typically includes recorded inflow and outflow hydrographs, river slope, channel network, channel roughness, and ice jam conditions (Fread, 1993). Reaches of different lengths were selected to assess the influence of river length on the application of flood routing methods.

River reach length (ΔL) and slope (S) were derived from a 200 m Digital Elevation Model (DEM) provided by the South African Atlas of Agrohydrology and Climatology (Schulze et al., 1997), using the ArcView 3.2a (ESRI, 2000) software package. Base values for Manning's roughness coefficient were estimated from field observations and additional sources. The catchment area and location of gauging weirs were obtained from the Department of Water Affairs and Forestry (DWAF) hydrology database available online.

3.3 Catchment Location

As illustrated in Figures 3.1 and 3.2, the Thukela catchment spans latitudinally from 27.410 to 29.400 S and longitudinally from 28.960 to 31.440 E, covering a total area of approximately 29,036 km2. The catchment comprises 86 interlinked and cascading Quaternary Catchments, as defined by the Department of Water Affairs and Forestry (DWAF) (Schulze and Taylor, 2002).


Figure 3.1 Thukela location map.

Figure 3.1 Thukela location map.


Figure 3.2 Selected gauging stationsstations.

Figure 3.2 Selected gauging stationsstations.


Figures 3.3, 3.4, and 3.5 depict selected sub-catchments, gauging stations, and river networks within the Thukela catchment. Due to the limitations of Muskingum methods outlined in Sections 2.1 and 2.2, as well as the lack of comprehensive data for many gauging weirs in the Thukela catchments, this study focuses on only three of the sub-catchments. The selection of these specific sub-catchments is primarily based on data availability.

A summary of weir site locations and other relevant information for each gauging station are included in Table 3.1.


Table 3.1 Summary of reaches and gauging stations used.

Reach Upstream and downstream Gauging Stations Location River Elevation [m] Catch. area [km2] Sub-Catch. area [km2] Reach Length [km] Average Channel Slope [%]
I V1H038 Dorpsgronde Klip 1042 1644 10 4.09 0.70
V1H051 Ladysmith Klip 1007 1654
II V2H002 Mooi Mooi 1390 937 609 54.40 0.55
V2H004 Doornkloof Mooi 1099 1546
III V2H004 Doornkloof Mooi 1099 1546 44 20.00 0.12
V2H001 Scheepersdaal Mooi 1075 1950


Figure 3.3 Selected gauging stations at the Klip river in Sub-catchment-I.

Figure 3.3 Selected gauging stations at the Klip river in Sub-catchment-I.


Figure 3.4 Selected gauging stations at the Mooi River in Sub-catchment-II.

Figure 3.4 Selected gauging stations at the Mooi River in Sub-catchment-II.


Figure 3.5 Selected gauging stations at the Mooi River in Sub-catchment-III.

Figure 3.5 Selected gauging stations at the Mooi River in Sub-catchment-III.


3.4 Characteristics of River Reaches

In June 2004, field visits were conducted to observe site conditions and assess factors affecting the Manning roughness coefficient (n) and the maximum bankfull top flow width (W) in the selected catchments. River reach information for all sub-catchments was collected during these visits, supplemented by data from the 1:50,000 South Africa Map (1989) and the 1:100,000 KZN Tourist Map (2003). The interpretation of the information gathered from the field survey is presented in Table 3.2. The average bankfull top width and maximum flow depth observed in the field were used to establish the maximum bankfull river flow. It was assumed that all channels represented stable channels, with approximate general top widths ranging between 30-70m and maximum flow depths between 2-5m.

The cross-sectional dimensions for the maximum top width (W) and maximum section depth (y) observed during the field visit have been documented in Table 3.2.

Table 3.2 Field observed data for assumed cross-sections.

Reach Top flow width (m) Maximum depth (m)
I 70 2.5
II 30 2
III 50 5


Table 3.3 Field survey data.

Reach Channel Shape Channel condition Meanderness Channel obstruction Channel vegetation cover Size
I Moderately Irregular Occasionally alternating Appreciable Negligible Small
II Moderately Irregular Occasionally alternating Severe Negligible Small
III Moderately Irregular Occasionally alternating Appreciable Negligible Small


3.4.1 Characteristics of Reach-I

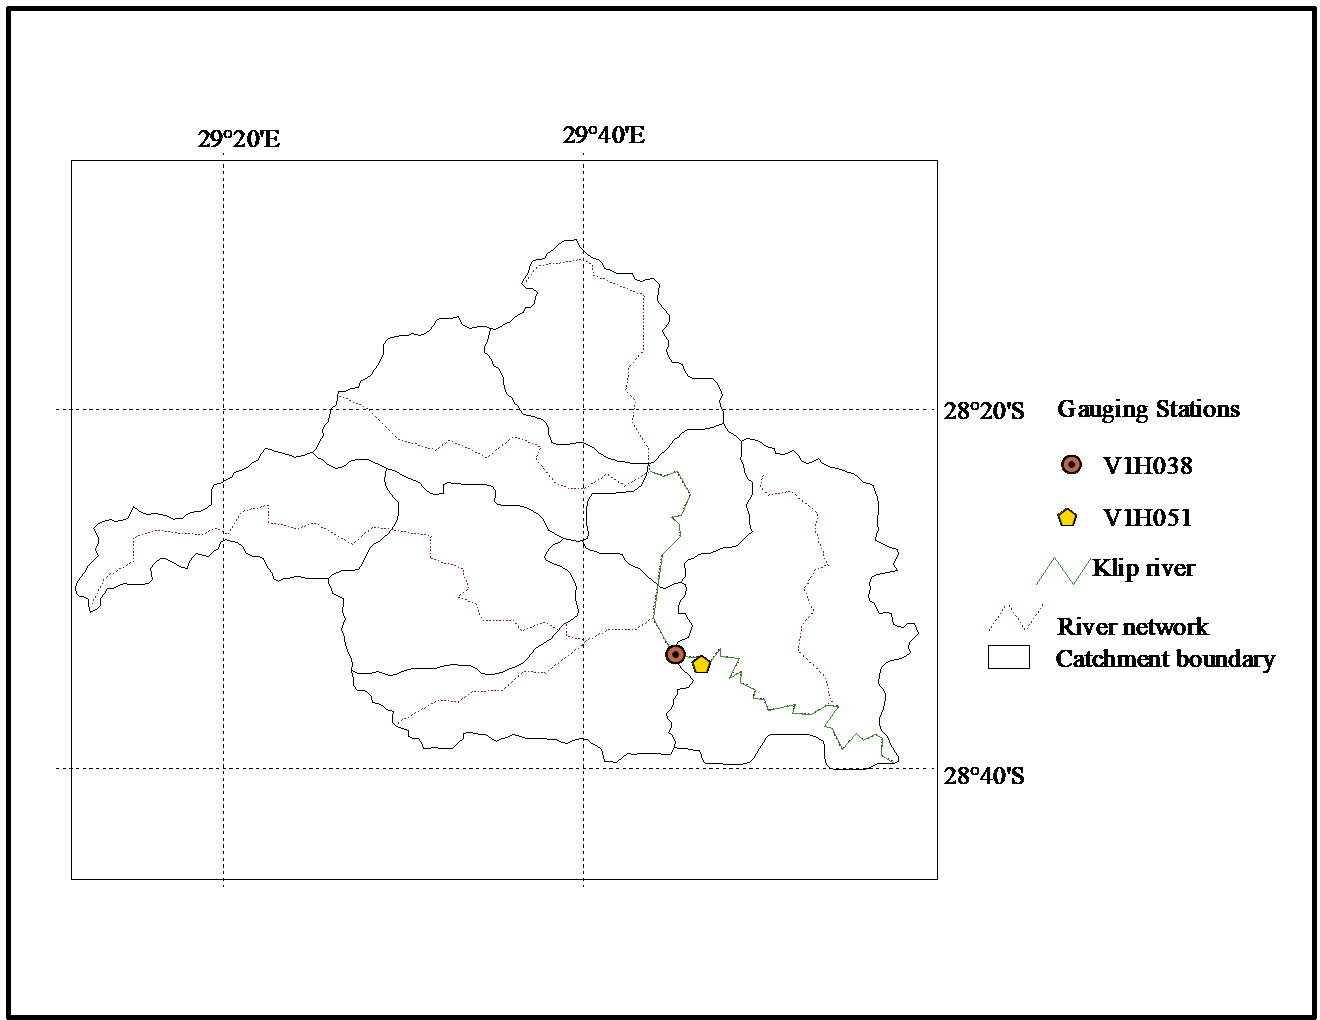
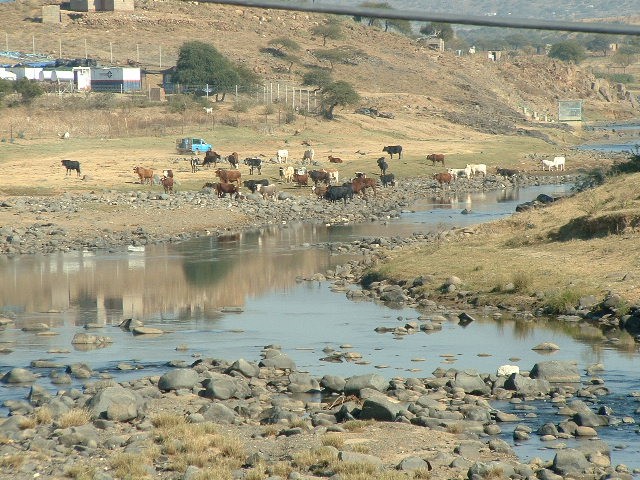
The Klip River exhibits a moderately irregular channel shape, characterized by occasional variations in cross-sectional width. With negligible obstructions and a channel length-to-valley length ratio estimated at 1.3, the river falls under the category of appreciable channel meandering, as outlined in Table 2.3 (Section 2.9.3). Along its course, the river features alternating medium vegetation cover. Figure 3.6 provides an illustrative example of the riparian vegetation found along the river.


Figure 3.6 The Klip River in Sub-catchment-I.

Figure 3.6 The Klip River in Sub-catchment-I.


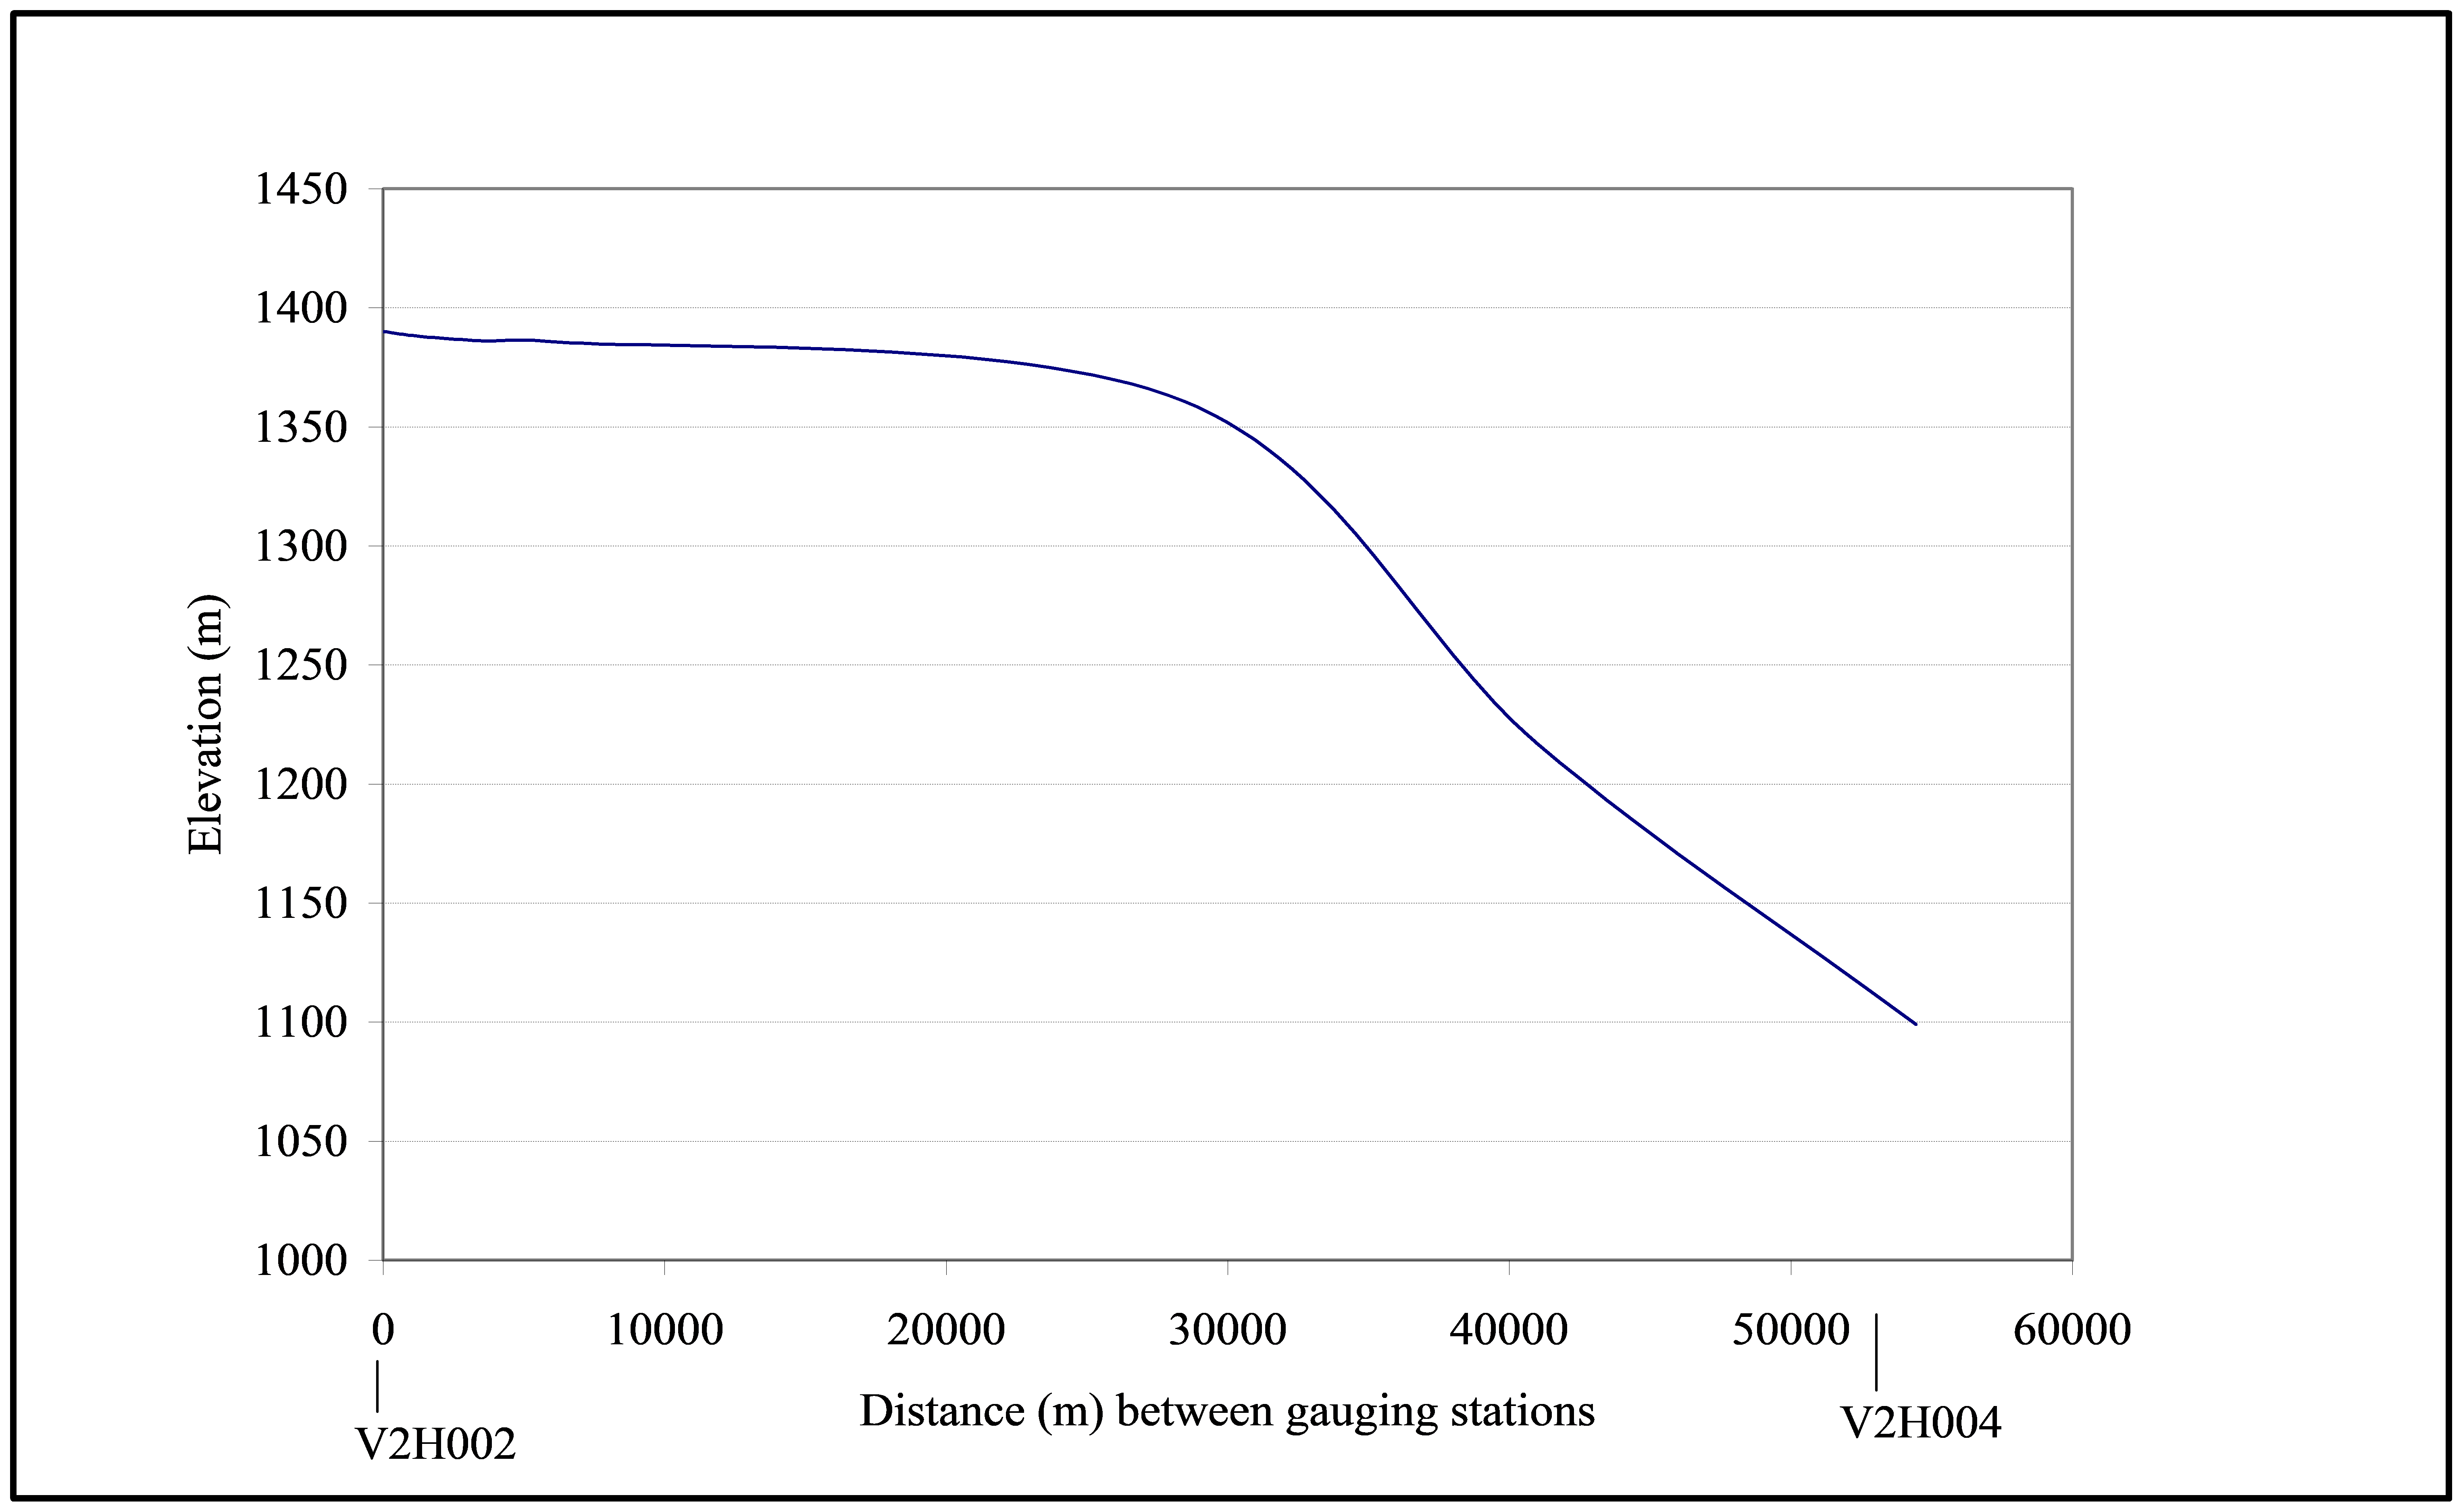
The main Klip River undergoes dramatic changes in slope, transitioning from a steep gradient to a much flatter slope, as illustrated in Figure 3.7. Approximately 46% of the upper reach exhibits a slope of 2.1%, while the remaining 54% of the downstream reach approaches a near-zero slope (flat). This variation indicates high-velocity flows upstream and significantly slower flow downstream.


Figure 3.7 Longitudinal profile of the Klip River in Sub-catchment-I.

Figure 3.7 Longitudinal profile of the Klip River in Sub-catchment-I.


3.4.2 Characteristics of Reach-II

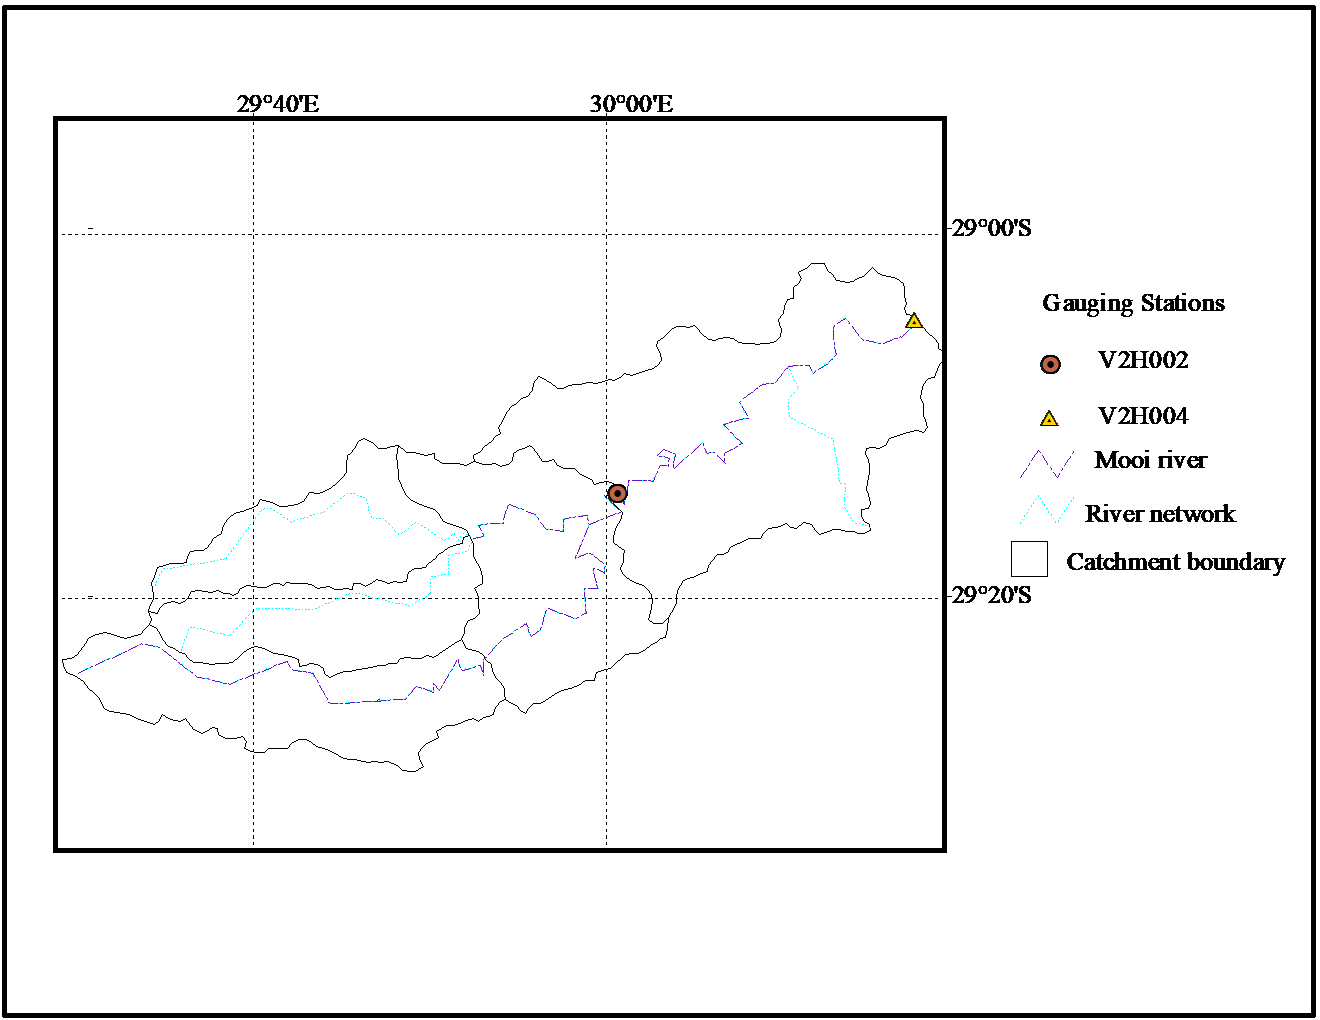
The Mooi River exhibits pronounced meandering, with a ratio of meandering channel length to its valley length estimated at 1.8. This classification places the river in the category of severely meandering, as indicated in Table 2.3 (Section 2.9.3). Along the river reach, there is alternating bushy vegetation cover, with riparian vegetation depicted in Figure 3.8.


Figure 3.8 The Mooi River in Sub-catchment-II.

Figure 3.8 The Mooi River in Sub-catchment-II.


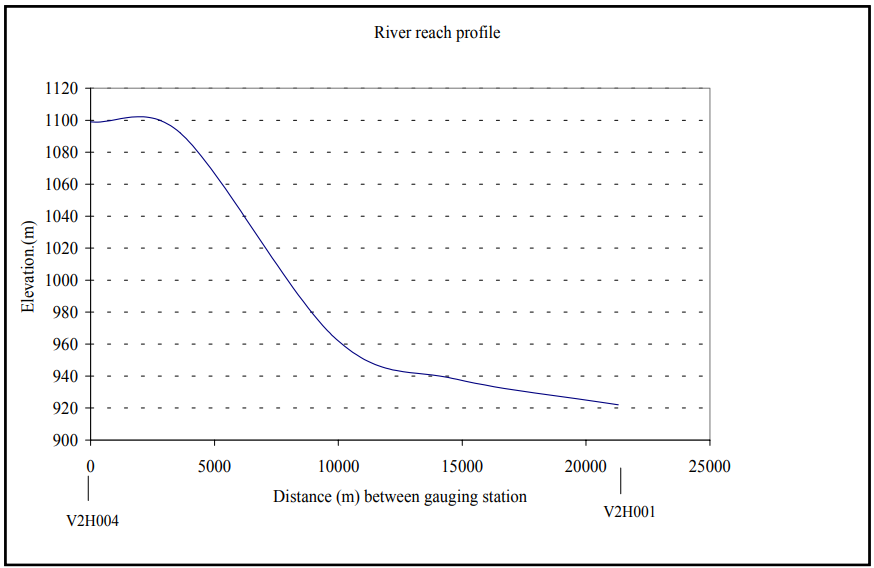
The slope of the primary river reach of the Mooi River is depicted in Figure 3.9.

Figure 3.9 Longitudinal profile of the Mooi River in Sub-catchment-II.

Figure 3.9 Longitudinal profile of the Mooi River in Sub-catchment-II.


3.4.3 Characteristics of Reach-III

Reach-III continues from the Mooi River downstream of Muden village and exhibits a moderately irregular channel shape, occasionally alternating in width of cross-sections. Downstream of the Mooi River, this reach has minimal obstructions. With a ratio of channel length to valley length estimated at 1.38, the river falls into the category of appreciably meandering channels, according to values in Table 2.3 (Section 2.9.3). Riparian vegetation along the Mooi River's downstream reach is shorter compared to the upper reaches. An example of this vegetation is depicted in Figure 3.10.


Figure 3.10 The Mooi River in Sub-catchment-III (Downstream).

Figure 3.10 The Mooi River in Sub-catchment-III (Downstream).


The slope of Reach-III is illustrated in Figure 3.11.


Figure 3.11 Longitudinal profile of the Mooi River in Sub-catchment-III(Downstream).

Figure 3.11 Longitudinal profile of the Mooi River in Sub-catchment-III(Downstream).


During the field visit, it was observed that the riverbed comprises cobbles with stable riverbanks. The base value (nb) for each channel was initially determined from values in Table 2.2 for a stable bed material channel condition with gravel size ranging from 2 to 64 mm. Adjustments were then made according to the observed channel condition, and total values were estimated using the Cowan (1956) method. The results of these estimations are presented in Table 3.4.


Table 3.4 Roughness coefficient values for the reaches.

Reach nb Irregularity Cross-Section Obstruction Vegetation Cover Meandering Final n
I 0.03 0.006 0.001 0 0.002 1.15 0.045
II 0.028 0.006 0.001 0 0.002 1.30 0.048
III 0.028 0.006 0.001 0 0.002 1.15 0.043

3.5 Analysis of Flow Data

The observed hydrograph data utilized in this study were obtained from DWAF (2003). The break point digitized data, considered primary data, had varying time steps initially. To ensure consistency, they were converted to a constant time step using a program developed by Smithers (2003). The chosen time step was sufficiently small to approximate the assumption of flow rate linearity over the time interval. Both small and large flood events were selected to encompass a range of flow conditions for comprehensive analysis.

Flow records for the three selected reaches in Sub-catchments I, II, and III are depicted in Figures 3.12, 3.13, and 3.14, respectively.


Figure 3.12 Observed inflows and outflows of Reach-I.

Figure 3.12 Observed inflows and outflows of Reach-I.


Figure 3.13 Observed inflows and outflows of Reach-II.

Figure 3.13 Observed inflows and outflows of Reach-II.


Figure 3.14 Observed inflows and outflows of Reach-III.

Figure 3.14 Observed inflows and outflows of Reach-III.


The rating curves for the selected reaches are illustrated in Figures 3.15 to 3.17.


Figure 3.15 Observed rating curve at gauging station V1H038 (after DWAF, 2003).

Figure 3.15 Observed rating curve at gauging station V1H038 (after DWAF, 2003).


Figure 3.16 Observed rating curve at gauging station V2H002 (after DWAF, 2003).

Figure 3.16 Observed rating curve at gauging station V2H002 (after DWAF, 2003).


Figure 3.17 Observed rating curve at gauging station V2H004 (after DWAF, 2003).

Figure 3.17 Observed rating curve at gauging station V2H004 (after DWAF, 2003).


The examination of the flow data revealed that certain hydrographs exhibited unrealistic records. These errors may stem from technical issues or inaccurate data acquisition methods. Notably, some events displayed premature peaks at downstream reaches, while others depicted exceptionally high peak values that surpassed the typical peaks observed at the gauge. Consequently, it is imperative to evaluate the data quality before proceeding with event selection for flood routing analyses. The discrepancies in some of the events become apparent when examining a single-event hydrograph on a larger scale, as depicted in Figure 3.18. It is plausible that the observed error in Figure 3.18 could be attributed to the incorrect digitization of a pen reversal on the autographically recorded chart.


Figure 3.18 Example of poor data in Reach-I.

Figure 3.18 Example of poor data in Reach-I.


Events were chosen to represent various sizes, including small, medium, and large events. The selected events for all reaches are illustrated in Figures 3.19 to 3.26. Specifically, events selected from Reach-I are depicted in Figures 3.19 to 3.20.


Figure 3.19 Events-1 and 2 selected from Reach-I.

Figure 3.19 Events-1 and 2 selected from Reach-I.


Figure 3.20 Event-3 selected from Reach-I.

Figure 3.20 Event-3 selected from Reach-I.


Figures 3.21 to 3.24 display the selected events from Reach-II.


Figure 3.21 Event-1 selected from Reach-II.

Figure 3.21 Event-1 selected from Reach-II.


Figure 3.22 Event-2 selected from Reach-II.

Figure 3.22 Event-2 selected from Reach-II.


Figure 3.23 Event-3 selected from Reach-II.

Figure 3.23 Event-3 selected from Reach-II.


Figure 3.24 Event-4 selected from Reach-II.

Figure 3.24 Event-4 selected from Reach-II.


Figures 3.25 to 3.26 illustrate the selected events from Reach-III.

Figure 3.25 Events-1 and 2 selected from Reach-III.

Figure 3.25 Events-1 and 2 selected from Reach-III.


Figure 3.26 Event-3 and 4 selected from Reach-III.

Figure 3.26 Event-3 and 4 selected from Reach-III.


In this chapter, we've discussed the selection of river reaches, gauging sites, and flood events. In the next chapter, we'll delve into the methodology used for analyzing and estimating K and X parameters in ungauged catchments.

Information Box


April 10, 2024